Far-field comparison with MSTM
05 December, 2023
Source:vignettes/1001_mstm_ff/1001_mstm_ff.Rmd
1001_mstm_ff.RmdObjective
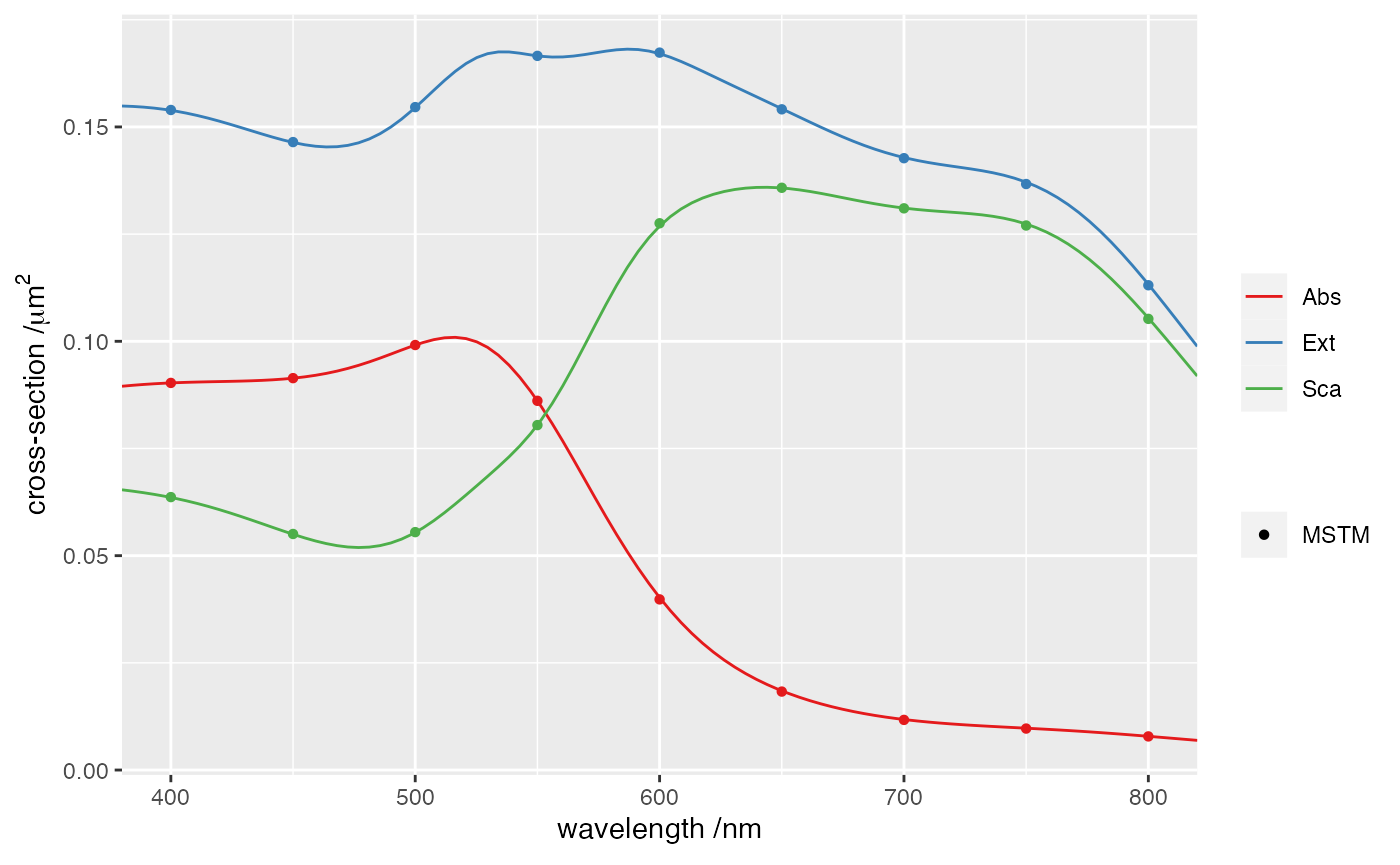
This example compares the results obtained with TERMS and MSTM for orientation-averaged far-field cross-sections of a helix of Au nanospheres.
This simulation uses the following input file
ModeAndScheme 2 3
Wavelength 380 820 100

MultipoleCutoff 12
Medium 1.0

ScattererCentredCrossSections

OutputFormat HDF5 terms

Scatterers 8
Au   1.200000e+02  0.000000e+00 -175 50
Au   8.485281e+01  8.485281e+01 -125 50
Au   7.347881e-15  1.200000e+02  -75 50
Au  -8.485281e+01  8.485281e+01  -25 50
Au  -1.200000e+02  1.469576e-14   25 50
Au  -8.485281e+01 -8.485281e+01   75 50
Au  -2.204364e-14 -1.200000e+02  125 50
Au   8.485281e+01 -8.485281e+01  175 50
where the helix geometry was obtained via the convenience R function:
The results are also shown for a comparable simulation using the MSTM package (version 4),
which implements the superposition T-matrix method for clusters of
spheres (note that TERMS uses similar algorithms in
Scheme=3).
The MSTM simulation is run with a separate input file for each wavelength (here 400 nm)
number_spheres
8
print_sphere_data
.true.
sphere_data
120,0,-175,50,(1.4753350745196,1.95608549562124)
84.8528137423857,84.8528137423857,-125,50,(1.4753350745196,1.95608549562124)
7.34788079488412e-15,120,-75,50,(1.4753350745196,1.95608549562124)
-84.8528137423857,84.8528137423857,-25,50,(1.4753350745196,1.95608549562124)
-120,1.46957615897682e-14,25,50,(1.4753350745196,1.95608549562124)
-84.8528137423857,-84.8528137423857,75,50,(1.4753350745196,1.95608549562124)
-2.20436423846524e-14,-120,125,50,(1.4753350745196,1.95608549562124)
84.8528137423857,-84.8528137423857,175,50,(1.4753350745196,1.95608549562124)
end_of_sphere_data
length_scale_factor
0.015707963267949
random_orientation
.true.
mie_epsilon
-12
output_file
400.dat
end_of_options